

Ukrainian Wedding Rushnyk Embroidery Towel Handmade Art Accessories Decor Easter (Blue Pattern)
Product details
| Management number | 208424224 | Release Date | 2026/03/22 | List Price | US$52.00 | Model Number | 208424224 | ||
|---|---|---|---|---|---|---|---|---|---|
| Category | |||||||||
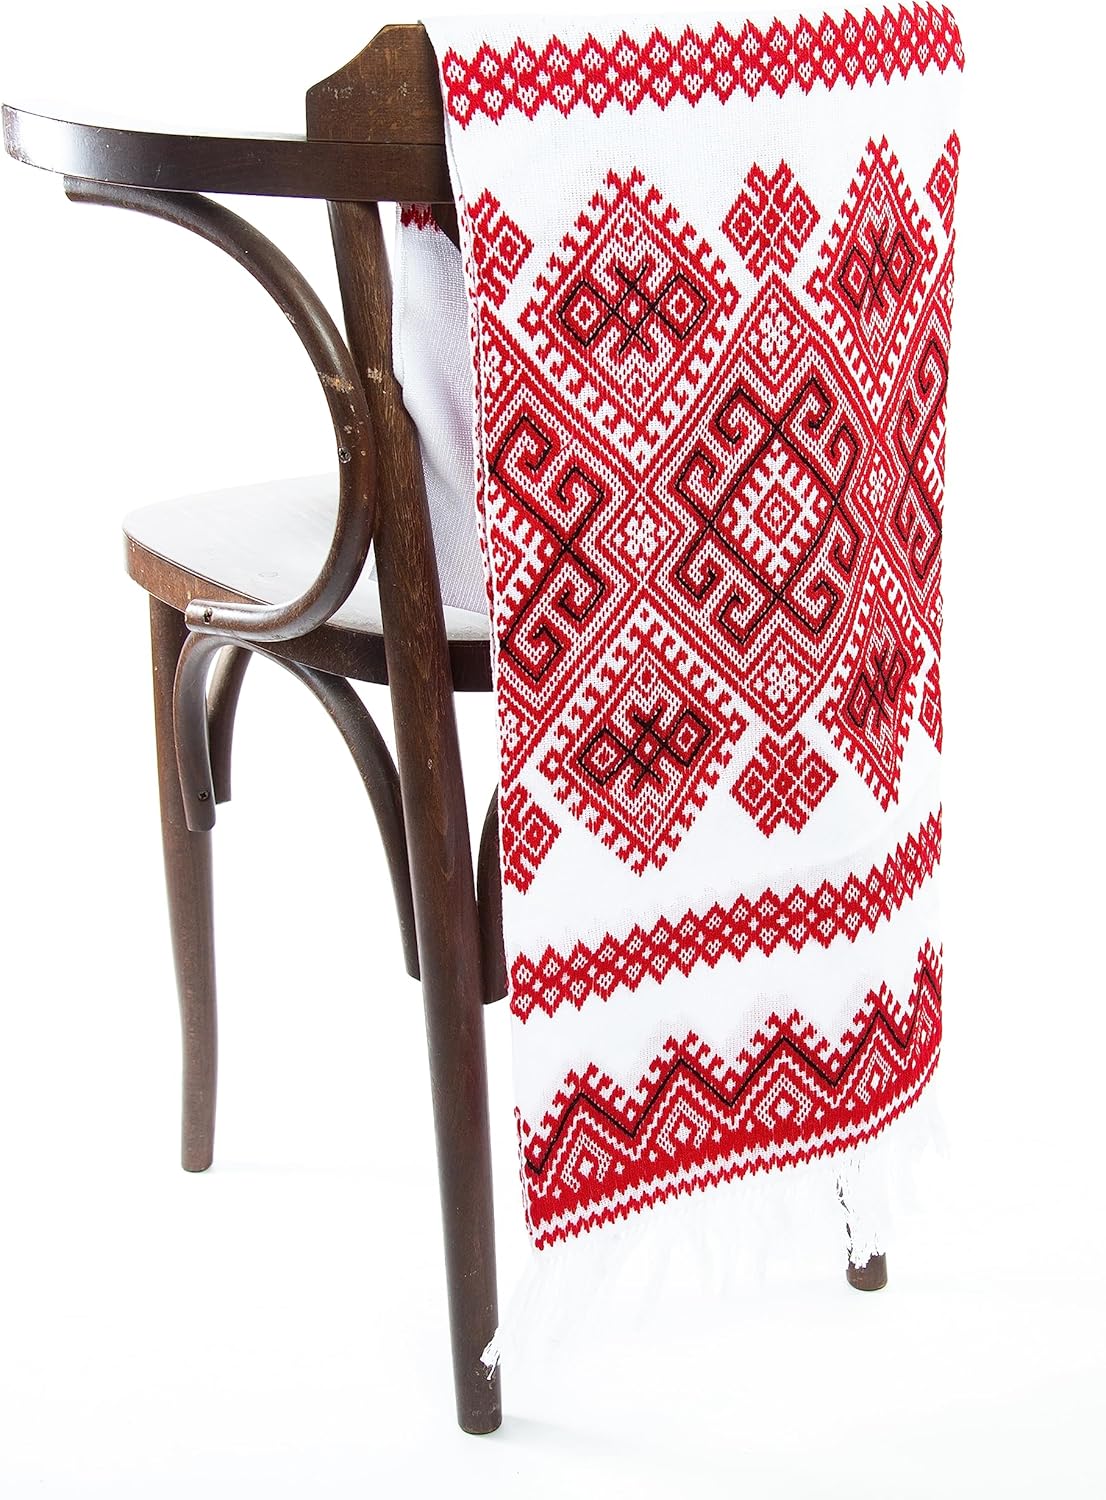
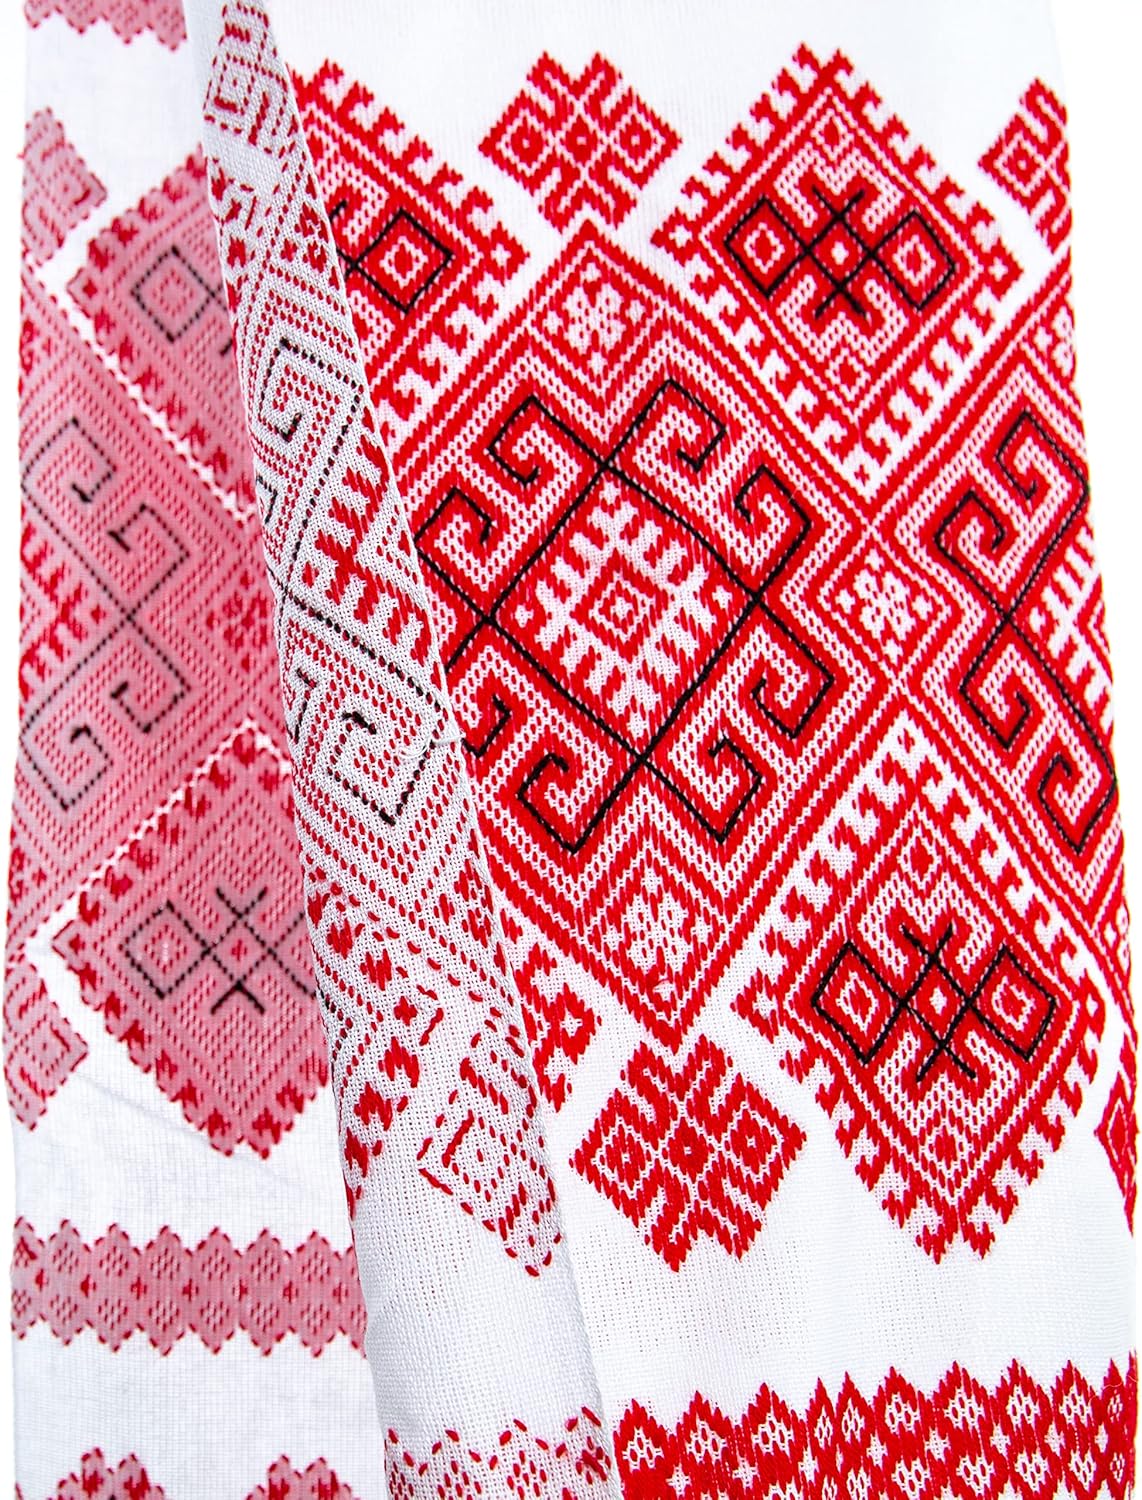
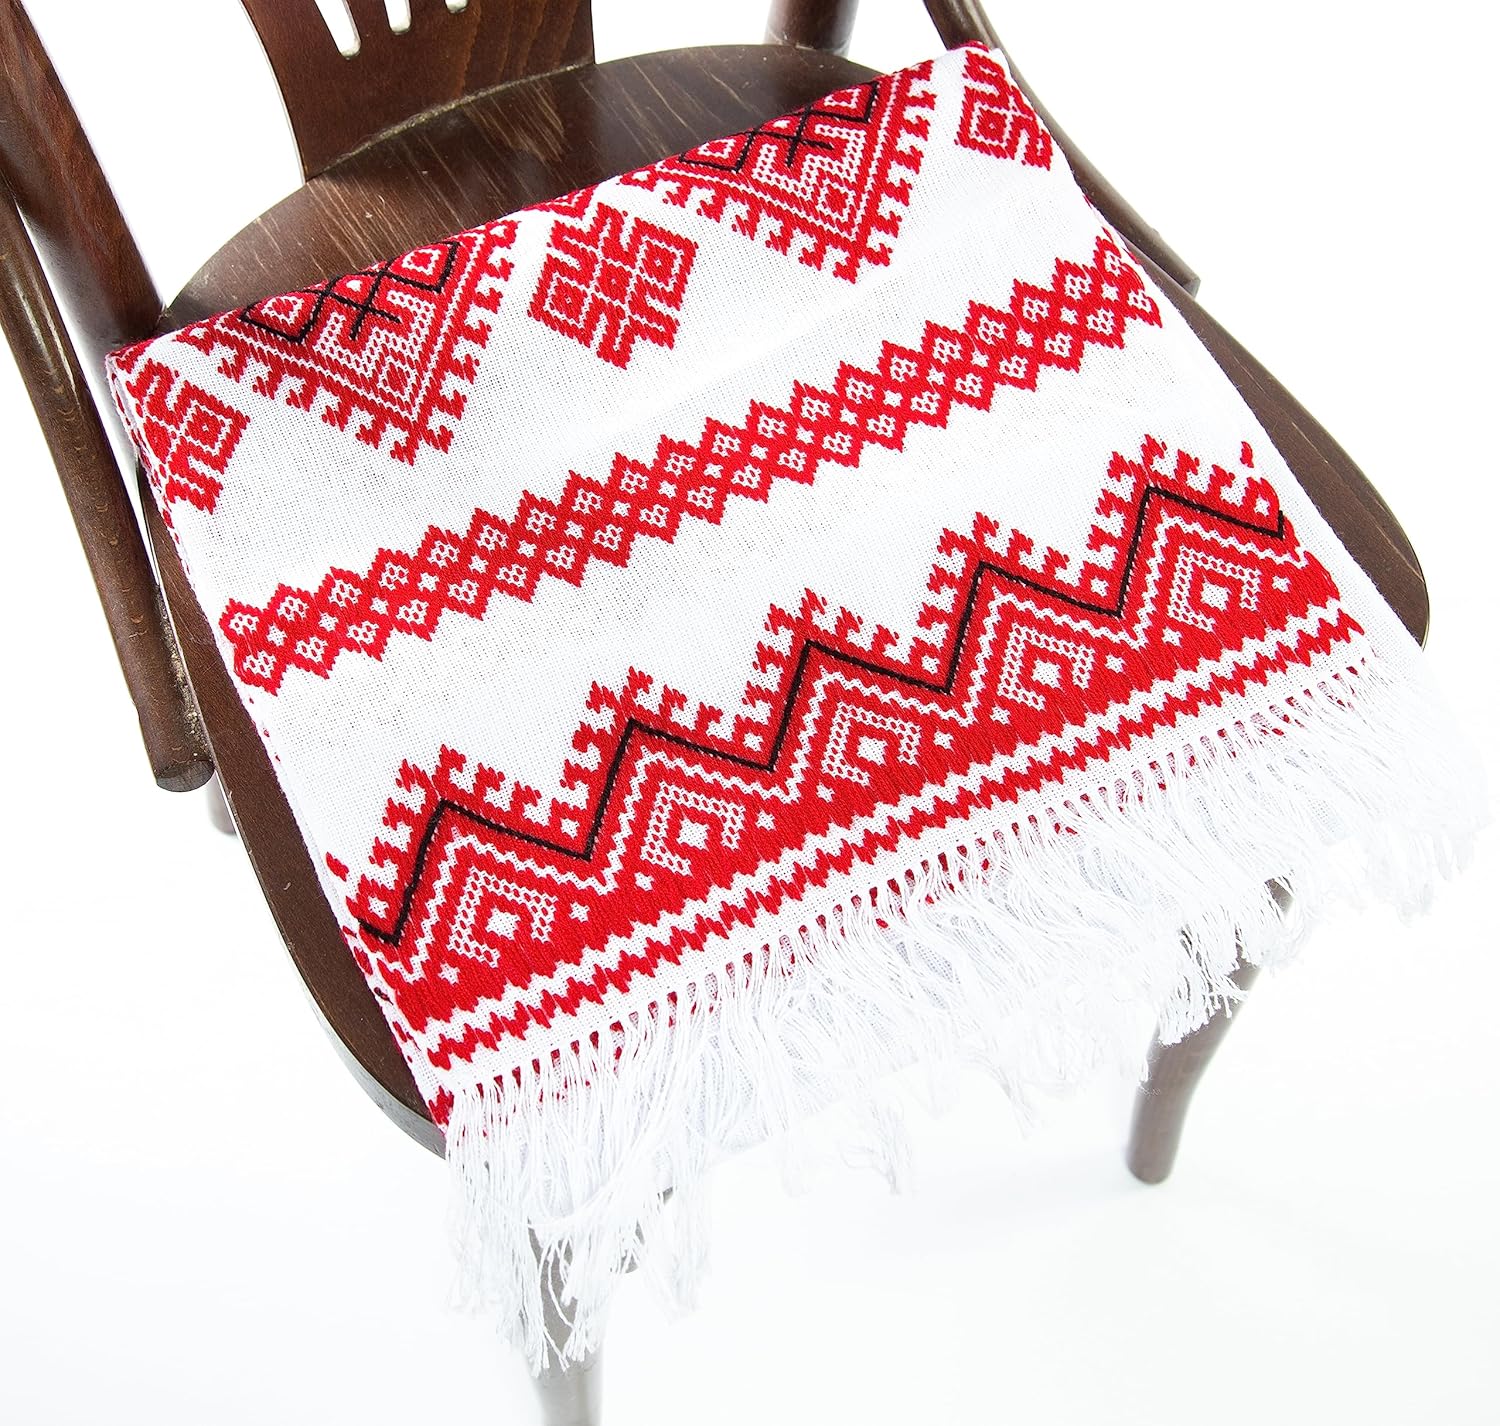
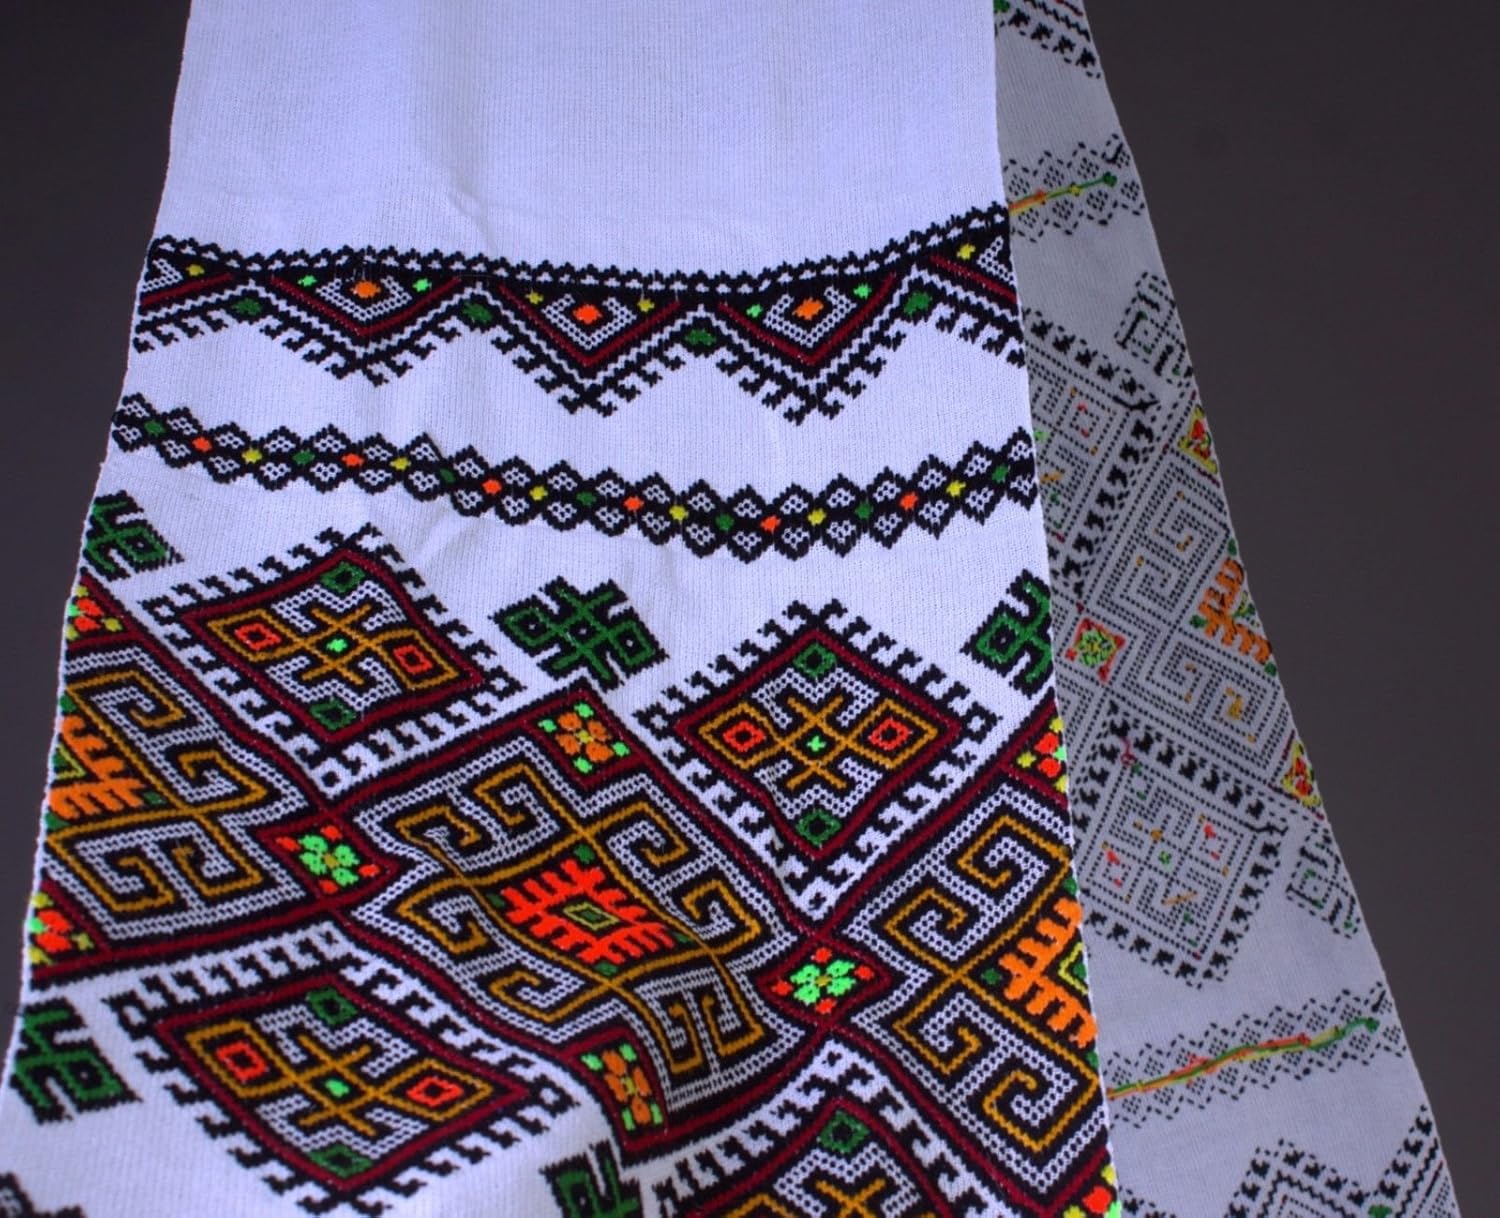
Introducing our exquisite Ukrainian wedding rushnyk, a hand-embroidered masterpiece crafted with love and tradition. Measuring an elegant 2 meters in length, this stunning piece is made from 100% cotton, ensuring a soft and durable quality that will stand the test of time. Our rushnyk features intricate satin-stitch designs that celebrate Ukrainian culture, symbolizing love, unity, and the start of a new journey together. This beautiful textile is perfect for various wedding rituals, from ceremonial blessings to as a decorative piece in your home, serving as a cherished keepsake for years to come. Ideal for couples looking to incorporate meaningful traditions into their wedding, our rushnyk not only enhances the beauty of your ceremony but also serves as a thoughtful gift for newlyweds. Embrace the essence of Ukrainian heritage with this stunning wedding rushnyk and make your special day unforgettable.
- 100% Cotton
- Handcrafted Elegance: Towel features beautiful hand embroidery using traditional satin-stitch techniques, making it a unique and special addition to your wedding celebrations
- Generous Size: Measuring 2 meters in length, this towel is perfect for various wedding rituals and can be used in multiple ways during your ceremony.
- Premium Quality Material: Made from 100% cotton, this wedding towel is soft, durable, and designed to last as a cherished keepsake for years to come.
- Cultural Significance: This wedding towel symbolizes love and unity in Ukrainian culture, making it an essential part of traditional wedding ceremonies.
- Versatile Use: Ideal for wedding ceremonies, it can also be displayed in your home as a decorative piece, adding a touch of cultural heritage to your decor.
- Perfect Gift Idea: A thoughtful gift for newlyweds, this towel embodies tradition and love, making it a memorable present for any wedding celebration.
| UPC | 795971882785 |
|---|---|
| Size | Small |
| Brand | Rushnichok |
| Color | Blue Pattern |
| Shape | Oval |
| Style | bohemian |
| Theme | Rustic |
| Pattern | handmade satin-stitch embroidered |
| Material | Cotton |
| Occasion | Easter, Wedding |
| Unit Count | 1.0 Count |
| Fabric Type | 100% Cotton |
| Item Weight | 6 ounces |
| Manufacturer | made in Ukraine |
| Number of Items | 1 |
| Special Feature | Lightweight |
| Target Audience | Women |
| Number of pieces | 1 |
| Item model number | R-3 |
| Batteries required | No |
| Product Dimensions | 74.8"L x 74.8"W |
| Product Care Instructions | Hand Wash Only |
| Is Discontinued By Manufacturer | No |


Bestseller ranking
Mitsubishi Montero Wiper Blades
![PowerClear by PowerStop PCK-2020-1 Front 20" + 20" Windshield Wiper Blade Set J-Hook Type For Ford F-150/F-250/F-350, Nissan Cube, Dodge Ram 1500, Ford Explorer, Ford Expedition [Model Specific]](https://i5.walmartimages.com/seo/PowerClear-PowerStop-PCK-2020-1-Front-20-20-Windshield-Wiper-Blade-Set-J-Hook-Type-Ford-F-150-F-250-F-350-Nissan-Cube-Dodge-Ram-1500-Ford-Explorer-Fo_659cf429-9f5b-44bd-9d64-434f4086fcde.44d037bfa9049e47e9cef10d17a29468.jpeg)
Customers who viewed this product also viewed
Hand Towels


Correction of product information
If you notice any omissions or errors in the product information on this page, please use the correction request form below.
Correction Request Form